
Why do companies consider offshore development in the first place? Generally, it’s about cost, and a cursory glance makes India or southeast Asia very attractive. Low hourly rates, massive talent pools, and decades of maturity make it look like an obvious choice.
But if you consider the true total cost of delivery, a different picture emerges.
The big numbers at the top of the page
Let’s begin with the easy math. Labor costs in India and southeast Asia (offshore) range from 40-70% lower than comparable skills in the US. Labor costs in LATAM (nearshore) range from 30-50% cheaper than US hiring. In both markets, these differences are driven by:
- Lower cost of living in offshore markets
- Larger supplies of engineering talent
- Highly competitive outsourcing ecosystems
Your new tech stack has a hidden cost stack
It’s hard to communicate
Offshore teams operate 8–12 hours ahead of US time zones. That delay introduces friction into even the simplest workflows.
A quick clarification can take a full day. Over time, that adds up to a 20-30% inefficiency factor due to:
- Delayed feedback loops
- Increased idle time
- Misaligned deliverables requiring rework
This inefficiency factor alone may eliminate the cost advantages of offshore teams. Nearshore teams eliminate this friction with 85%+ workday alignment.
You need more managers more often
Offshore delivery models often require additional management layers to ensure a successful project, like:
- Project managers to bridge time zones
- Additional time spent documenting workflows
- Status meetings or reports to compensate for lack of real-time visibility
This “double management” structure typically adds 15-35% to total project cost. In poorly structured engagements, it can push past 40%. As with the communications factor, this alone can eliminate the hourly rate advantage of offshoring.
You need to watch quality more closely
Lower hourly rates sometimes come with trade-offs:
- More QA cycles
- Increased need for oversight
- Rework due to miscommunication or unclear requirements
Offshoring often requires additional investment in:
- Code reviews
- Testing cycles
- Documentation
These hidden costs, while not as significant as communications and management overhead, have an estimated cost impact of 5-10% of total project costs. While not enough to eliminate the hourly rate advantage of offshoring, this exacerbates the other costs.
People churn faster
Turnover is one of the most underestimated cost drivers in outsourcing. Offshore markets, particularly highly competitive hubs, tend to experience attrition rates between 20-35%, with nearshore coming in around 10-20%.
Replacing a developer mid-project has some direct costs associated with it, such as recruitment fees, lost productivity due to onboarding, and lost institutional knowledge. When fully accounted for, replacement costs can exceed $25,000 per hire.
While the direct costs certainly are eye-opening, there’s an additional effect that’s hard to quantify, and it’s a multiplier effect. Taking into account the lost productivity of onboarding, knowledge transfer time, recruiting and onboarding costs, and the loss of development velocity across the project, that replacement multiplier ends up being between 50% and 150% of the developer’s monthly salary.
Longer, more expensive trips
Traveling offshore is expensive. With 3-5 people making 2-4 trips per year, estimated costs including flights, hotel stays, per diem, and ground transportation comes to an annual travel cost between $15,000 and $60,000, representing 3-8% of total project cost. Some of this cost is driven by longer stays due to distance, and higher flight costs to offshore destinations.
Nearshore changes that dynamic. Trips are generally shorter and flights less expensive. Even factoring in more frequent trips, annual travel costs average between $5000 and $20,000, or 1-3% of project costs.
Compliance is more complicated
It’s a good rule of thumb that the further away from your home country you roam, the more complex the legal frameworks required. You also have to consider additional data security frameworks and alignment, IP protection, and multi-entity payment structures. Between initial setup, ongoing compliance, and administrative overhead, annual costs average between $20,000 and $80,000, representing an increase in project costs of 5%-12%.
LATAM’s legal frameworks, while somewhat different than the US, are better aligned for business with their neighbors to the north. Data governance also becomes easier, reducing total compliance and legal costs to between $10,000 and $30,000, representing 2-5% of project costs.
There’s friction in the system
While operational friction is difficult to quantify, it’s one of the most expensive project cost escalations. It shows up in idle time, delayed decisions because of overnight feedback loops, meeting duplication, slower sprints, and more escalation cycles. Assuming 1-2 hours of productivity loss per day per team member from asynchronous operations, that represents a 12-25% productivity loss, with a cost impact on the project between 10% and 25%.
In fairness, LATAM doesn’t have zero operational friction, but overall productivity loss is reduced by real-time collaboration, shared working hours, and faster iteration. Estimated productivity loss drops to between 5% and 10%.
Total cost of ownership
Let’s take what we’ve just modeled and create an example. Let’s assume you’ve got a project with a base cost of $500,000 if you were to complete it with onshore labor. Using the median costs in each category, your project costs are as follows:
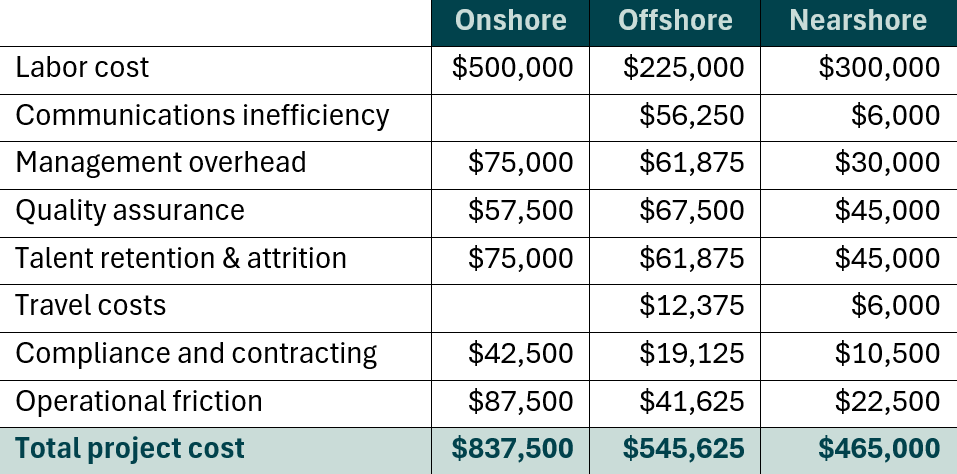
Even with the significant labor cost advantage of nearshore, at the median it’s more than offset by the cost stack offset.
While offshoring wins in hourly rate, nearshoring wins on outcomes. And when speed, collaboration, and quality drive competitive advantage, that distinction matters more than ever.
If you’re looking to scale efficiently and more cost-effectively without sacrificing execution, nearshoring is likely the smarter financial decision.